Investment Management
Offering a range of different strategies to meet varying client needs.
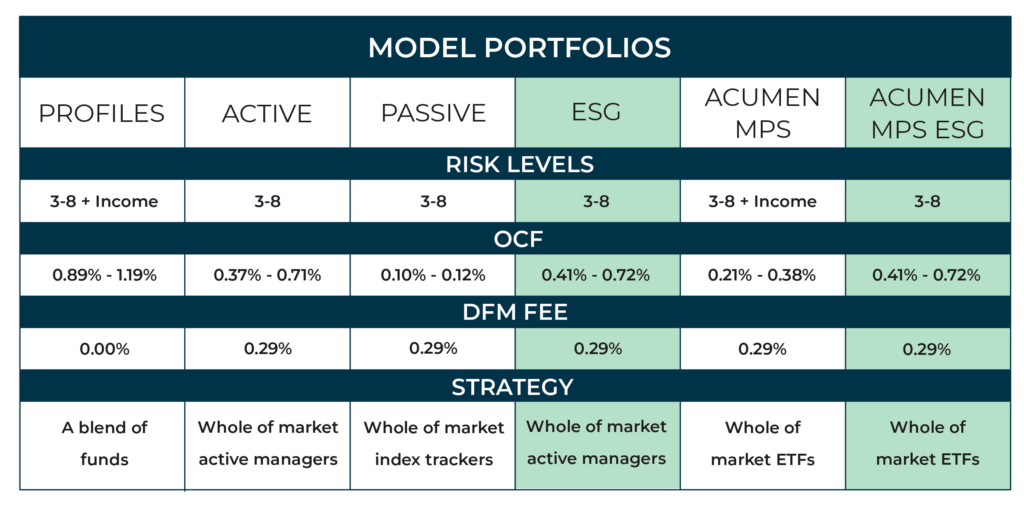
Tavistock Asset Management manages a range of diversified, multi-asset mandates with clear objectives, clear risk levels and broad exposures to underlying investment expertise across the market.
Each mandate is managed for clients by professional investment managers and there is a full range of risk profiles, different levels of active management and a choice of portfolio structures.
We work with you to find the most suitable option for your client, allowing you to spend more time planning your clients’ future whilst benefitting from our specialist investment expertise and analysis.
The mandates currently available are outlined in the table below.
Factsheets and literature
For the latest Tavistock Asset Management factsheets and literature click below:
Latest Insights

New tax year: Spring clean your finances
As the calendar pages turn to a new tax year, it’s a perfect moment for a bit of financial spring cleaning. With the arrival of the new tax year, there’s a fresh opportunity to review, reset, and rejuvenate your financial strategy. Whether you’re aiming to grow your savings, optimize your investments, or just get a clearer picture of where you stand, now is the time to take action. Here are some the things to consider early on in a new tax year.

Surmounting bias, fostering mentorship and paying it forward: Amy Chidgey
In celebration of International Women’s Day 2024, Tavistock Investments is shining a spotlight on some of our colleagues and their journeys within the finance and investment sector.

Lifetime ISAs Explained
An ISA is a valuable tax wrapper around your savings and investments. Paying no tax means your savings and investments can grow faster.